> ## Documentation Index
> Fetch the complete documentation index at: https://docs.thoras.ai/llms.txt
> Use this file to discover all available pages before exploring further.
# Metrics
> Thoras exposes native Prometheus metrics that offer real-time visibility into the actions and health of the Thoras system. This empowers your teams with deeper insights, transparency, and observability.
## Overview
### Action Metrics
See Thoras in action. These metrics provide insight into how Thoras actively
manages your application resources across your environment. They track when
Thoras takes autonomous action to scale horizontally or vertically, when
replicas or resource allocations differ from Thoras' desired values, and how
each `AIScaleTarget` is currently operating. Together, these metrics give teams
the visibility they need to understand scaling behavior, make informed
decisions, and maintain efficient, well-performing applications.
| Metric Name | Type | Description | Labels |
| ---------------------------------------------------------- | ------- | ------------------------------------------------------------------------------------------------------------------------------------------------------------------------------------------------------------------- | ------------------------------------------------------------------------------- |
| [`thoras_horizontal_scale_total`](#horizontal-scale-total) | Counter | Counts horizontal scaling actions in autonomous mode | `ai_scale_target`, `scale_metric`, `namespace` |
| [`thoras_vertical_scale_total`](#vertical-scale-total) | Counter | Counts vertical scaling adjustments in autonomous mode | `ai_scale_target`, `namespace` |
| [`thoras_recommendation`](#recommendation) | Gauge | Current scaling recommendation per `AIScaleTarget` | `ai_scale_target`, `resource`, `namespace`, `container`, `unit` |
| [`thoras_scale_targets`](#scale-targets) | Gauge | The count of `AIScaleTargets` in various operational modes (autonomous or recommendation) | `vertical`, `horizontal` |
| [`thoras_provisioning_ratio`](#provisioning-ratio) | Gauge | Ratio of current resource usage to the predicted maximum usage within the forecasted period. Values > 1 indicate current usage exceeding predicted maximum, values \< 1 indicate usage below the predicted maximum. | `ai_scale_target`, `namespace`, `scaling_mode`, `resource`, `container`, `mode` |
| [`thoras_provisioning_delta`](#provisioning-delta) | Gauge | Absolute difference between current resource usage and predicted maximum usage within the forecasted period. Units depend on resource type (bytes for memory, cores for CPU). | `ai_scale_target`, `namespace`, `scaling_mode`, `resource`, `container`, `mode` |
| [`thoras_workload_oom_killed_total`](#workload-oom-killed) | Counter | Total OOM kill events observed per workload | `ast_name`, `namespace` |
| [`thoras_ast_active_suggestion`](#ast-active-suggestion) | Gauge | 1 if the `AIScaleTarget` has an active suggestion at last check, 0 if missing. Only set for auto-mode ASTs past their startup grace period. | `ai_scale_target`, `namespace`, `uid` |
| [`thoras_ast_metric_integrity`](#ast-metric-integrity) | Gauge | 1 if metrics for the `AIScaleTarget` were collected in the last check interval, 0 if stale. Workloads at zero replicas for the entire window count as healthy. ASTs inside the creation grace period are absent. | `ai_scale_target`, `namespace`, `uid` |
### System Health Metrics
Observe the state of Thoras' system health. These metrics offer a window into
the health and performance of the Thoras platform. They can also be easily
integrated into popular observability tools like Datadog, Grafana, giving your
team the flexibility to monitor Thoras wherever you already track system
performance.
| Metric Name | Type | Description | Labels |
| ----------------------------------------------------------------------------------------- | ------- | ------------------------------------------------------------------------------ | ------------------------ |
| [`thoras_api_http_response_total`](#api-http-response-total) | Counter | Tracks total HTTP responses from internal API; spikes may indicate issues | `path`, `method`, `code` |
| [`thoras_api_http_request_duration_seconds`](#api-http-request-duration) | Gauge | Captures average internal API response time; highlights potential slowdowns | `path`, `method` |
| [`thoras_forecast_queue_pending_count`](#forecast-queue-pending-count) | Gauge | Number of pending forecast jobs currently in the queue | `action` |
| [`thoras_forecast_queue_pending_oldest_duration_seconds`](#forecast-queue-pending-oldest) | Gauge | Duration in seconds that the oldest forecast job has been pending in the queue | |
| [`thoras_forecast_queue_status_count`](#forecast-queue-status-count) | Counter | Number of forecast jobs by status | `status` |
| [`thoras_job_completions_total`](#job-completions-total) | Counter | Total number of completed jobs by status and kind | `status`, `kind` |
| [`thoras_job_duration_seconds`](#job-duration-seconds) | Gauge | Duration of jobs in seconds by status and kind | `status`, `kind` |
## Advanced Usage
### Provisioning Ratio
**Metric:** `thoras_provisioning_ratio`
The provisioning ratio compares your current resource usage to the Thoras
recommended request. The Thoras recommended request is based on the predicted
maximum usage during the forecasted period.
**Interpretation:**
Note: Recommendations are based on the predicted maximum usage over the forecast
window. Utilization ratio lowers when preemptive up-scaling occurs.
* `ratio > 1.0`: Current usage exceeding predicted maximum
* `ratio < 1.0`: Current usage below predicted maximum
**Calculation:**
* **Vertical scaling**: `current_avg_request / recommended_request`
* **Horizontal scaling**: `current_total_usage / forecasted_value`
**Example Queries & Dashboards:**
```promql theme={null}
# Find workloads with current usage more than 20% above suggested request (under predicted).
thoras_provisioning_ratio{scaling_mode="horizontal"} > 1.2
# Count workloads with current usage more than 20% above suggested request (under predicted).
count (thoras_provisioning_ratio > 1.2) # Over-provisioned
# View provisioning ratio for a specific AIScaleTarget
thoras_provisioning_ratio{ai_scale_target="cartservice"}
```
### Provisioning Delta
**Metric:** `thoras_provisioning_delta`
The provisioning delta shows the absolute difference between your current
resource usage and Thoras recommended request. The Thoras recommended request is
based on the predicted maximum usage during the forecasted period.
**Units:**
* Memory: bytes
* CPU: cores
**Calculation:**
* `abs(current_value - recommended_value)`
**Example Queries & Dashboards:**
```promql theme={null}
# Find memory deltas exceeding 1GB
thoras_provisioning_delta{resource="memory", unit="bytes"} > 1073741824
# View CPU delta for a specific workload
thoras_provisioning_delta{ai_scale_target="cartservice", resource="cpu"}
# Memory waste from over-provisioning (in GB) - combines ratio + delta
(thoras_provisioning_delta{resource="memory", unit="bytes"}
* on(ai_scale_target, namespace) group_left()
(thoras_provisioning_ratio > 1)) / 1073741824
```
### Horizontal Scale Total
**Metric:** `thoras_horizontal_scale_total`
Tracks the total number of horizontal scaling actions Thoras has performed in
autonomous mode. Each increment represents a scaling event where Thoras adjusted
replica counts.
**Example Queries & Dashboards:**
```promql theme={null}
# Total horizontal scaling actions across all targets
sum(thoras_horizontal_scale_total)
# Scaling actions per AIScaleTarget
sum by (ai_scale_target) (thoras_horizontal_scale_total)
# Scaling actions per namespace
sum by (namespace) (thoras_horizontal_scale_total)
# Rate of scaling actions over the last hour
rate(thoras_horizontal_scale_total[1h])
```
### Vertical Scale Total
**Metric:** `thoras_vertical_scale_total`
Tracks the total number of vertical scaling actions Thoras has performed in
autonomous mode. Each increment represents a scaling event where Thoras adjusted
resource requests or limits.
**Example Queries & Dashboards:**
```promql theme={null}
# Total vertical scaling actions across all targets
sum(thoras_vertical_scale_total)
# Scaling actions per AIScaleTarget
sum by (ai_scale_target) (thoras_vertical_scale_total)
# Scaling actions per namespace
sum by (namespace) (thoras_vertical_scale_total)
# Rate of scaling actions over the last hour
rate(thoras_vertical_scale_total[1h])
# Compare horizontal vs vertical scaling activity
sum(thoras_horizontal_scale_total) / sum(thoras_vertical_scale_total)
```
### Recommendation
**Metric:** `thoras_recommendation`
Shows Thoras' current scaling recommendation for each `AIScaleTarget`. The value
and unit depend on the resource type being recommended.
**Units:**
* Memory: bytes
* CPU: cores
* Replicas: count
**Example Queries & Dashboards:**
```promql theme={null}
# Current memory recommendations (in GB)
thoras_recommendation{resource="memory", unit="bytes"} / 1073741824
# Current CPU recommendations
thoras_recommendation{resource="cpu"}
# Recommendations for a specific AIScaleTarget
thoras_recommendation{ai_scale_target="cartservice"}
# Compare recommendations across containers in a workload
thoras_recommendation{ai_scale_target="frontend"} by (container, resource)
```
### Scale Targets
**Metric:** `thoras_scale_targets`
Reports the count of `AIScaleTargets` currently managed by Thoras, broken down
by operational mode (autonomous or recommendation) and scaling dimension
(vertical or horizontal).
**Example Queries & Dashboards:**
```promql theme={null}
# Total AIScaleTargets managed by Thoras
sum(thoras_scale_targets)
# Count of vertical scaling targets
thoras_scale_targets{vertical="true"}
# Count of horizontal scaling targets
thoras_scale_targets{horizontal="true"}
# Targets with both vertical and horizontal scaling enabled
thoras_scale_targets{vertical="true", horizontal="true"}
```
### Workload OOM Killed
**Metric:** `thoras_workload_oom_killed_total`
Counts the total number of OOM (Out of Memory) kill events observed per
workload. Each increment represents a container that was terminated due to
exceeding its memory limit. Use this metric to identify workloads that are
frequently running out of memory and may need higher memory recommendations.
**Example Queries & Dashboards:**
```promql theme={null}
# Total OOM kills across all workloads
sum(thoras_workload_oom_killed_total)
# OOM kills per workload
sum by (ast_name) (thoras_workload_oom_killed_total)
# OOM kills per namespace
sum by (namespace) (thoras_workload_oom_killed_total)
# Rate of OOM kills over the last hour
rate(thoras_workload_oom_killed_total[1h])
# Workloads with the most OOM kills
topk(10, sum by (ast_name, namespace) (thoras_workload_oom_killed_total))
# Alert on OOM kills in the last 15 minutes
increase(thoras_workload_oom_killed_total[15m]) > 0
```
### AST Active Suggestion
**Metric:** `thoras_ast_active_suggestion`
Indicates whether each auto-mode `AIScaleTarget` has an active suggestion at the
time of the last periodic check. The value is `1` when a suggestion exists and
`0` when no suggestion is present. ASTs still within their startup grace period
are excluded.
**Example Queries & Dashboards:**
```promql theme={null}
# ASTs currently missing a suggestion
thoras_ast_active_suggestion == 0
# Count of ASTs missing a suggestion
count(thoras_ast_active_suggestion == 0)
# Alert when any AST has been missing a suggestion for 15m
max_over_time(thoras_ast_active_suggestion[15m]) == 0
```
### AST Metric Integrity
**Metric:** `thoras_ast_metric_integrity`
Note: Requires metric integrity monitor to be enabled via values.yaml
Reports whether Thoras has successfully collected CPU/memory metrics for each
`AIScaleTarget` in the most recent check interval. The value is `1` when the AST
is healthy and `0` when metrics are stale (the workload was running but no
CPU/memory samples were collected). Workloads that sat at zero replicas for the
entire window count as healthy, since no metrics are expected. ASTs still within
their creation grace period, as well as orphaned ASTs whose scale target no
longer exists, are absent from the metric entirely.
Use this metric to detect a wedged collector or broken metrics pipeline for a
specific workload.
**Example Queries & Dashboards:**
```promql theme={null}
# ASTs with stale metrics
thoras_ast_metric_integrity == 0
# Count of ASTs with stale metrics
count(thoras_ast_metric_integrity == 0)
# Alert when any AST has been stale for 60m
max_over_time(thoras_ast_metric_integrity[60m]) == 0
```
### API HTTP Response Total
**Metric:** `thoras_api_http_response_total`
Tracks the total number of HTTP responses from Thoras' internal API. This
counter increments for every API response and can help identify unusual traffic
patterns or issues.
**Example Queries & Dashboards:**
```promql theme={null}
# Total API responses
sum(thoras_api_http_response_total)
# Response rate over the last 5 minutes
rate(thoras_api_http_response_total[5m])
# Responses by status code
sum by (code) (thoras_api_http_response_total)
# Error rate (4xx and 5xx responses)
sum(rate(thoras_api_http_response_total{code=~"4..|5.."}[5m]))
# Requests by endpoint
sum by (path, method) (thoras_api_http_response_total)
# Success rate percentage
(sum(rate(thoras_api_http_response_total{code=~"2.."}[5m]))
/ sum(rate(thoras_api_http_response_total[5m]))) * 100
```
### API HTTP Request Duration
**Metric:** `thoras_api_http_request_duration_seconds`
Measures the average response time for Thoras' internal API requests in seconds.
Rising values may indicate performance degradation or capacity issues.
**Example Queries & Dashboards:**
```promql theme={null}
# Response time by endpoint
avg by (path) (thoras_api_http_request_duration_seconds)
# Average response time over the last hour
avg_over_time(thoras_api_http_request_duration_seconds[1h])
```
### Forecast Queue Pending Count
**Metric:** `thoras_forecast_queue_pending_count`
**Labels:** `action` (`forecast` or `train`)
Shows the current number of pending jobs waiting in the queue, broken down by
action type. High values indicate that requests are backing up, which may signal
worker capacity issues or processing bottlenecks.
**Example Queries & Dashboards:**
```promql theme={null}
# Current pending count by action
thoras_forecast_queue_pending_count
# Pending forecast jobs only
thoras_forecast_queue_pending_count{action="forecast"}
# Pending train jobs only
thoras_forecast_queue_pending_count{action="train"}
# Total pending jobs across all actions
sum(thoras_forecast_queue_pending_count)
# Maximum pending count over the last hour
max_over_time(thoras_forecast_queue_pending_count[1h])
# Alert on high queue depth (> 10 jobs total)
sum(thoras_forecast_queue_pending_count) > 10
```
### Forecast Queue Pending Oldest
**Metric:** `thoras_forecast_queue_pending_oldest_duration_seconds`
Tracks how long the oldest forecast job has been waiting in the queue. Rising
values indicate jobs are not being processed quickly enough.
**Example Queries & Dashboards:**
```promql theme={null}
# Current oldest job wait time
thoras_forecast_queue_pending_oldest_duration_seconds
# Maximum wait time over the last day
max_over_time(thoras_forecast_queue_pending_oldest_duration_seconds[24h])
# Average wait time over the last day
avg_over_time(thoras_forecast_queue_pending_oldest_duration_seconds[24h])
```
### Forecast Queue Status Count
**Metric:** `thoras_forecast_queue_status_count`
Tracks the total number of forecast jobs processed, categorized by status. This
counter helps monitor forecast job lifecycle and identify issues with job
processing.
**Example Queries & Dashboards:**
```promql theme={null}
# Total forecast jobs by status
sum by (status) (thoras_forecast_queue_status_count)
# Rate of forecast jobs by status over the last day
rate(thoras_forecast_queue_status_count[24h])
# Failed forecast jobs
sum(thoras_forecast_queue_status_count{status="failed"})
# Success rate percentage
(sum(rate(thoras_forecast_queue_status_count{status="completed"}[24h]))
/ sum(rate(thoras_forecast_queue_status_count[24h]))) * 100
# Total forecast jobs processed
sum(thoras_forecast_queue_status_count)
```
### Job Completions Total
**Metric:** `thoras_job_completions_total`
Tracks the total number of completed jobs, categorized by status (success,
failure, etc.) and job kind. This counter helps identify job failure rates and
patterns across different job types.
**Example Queries & Dashboards:**
```promql theme={null}
# Total job completions
sum(thoras_job_completions_total)
# Job completions by status
sum by (status) (thoras_job_completions_total)
# Job completions by kind
sum by (kind) (thoras_job_completions_total)
# Failed jobs only
sum(thoras_job_completions_total{status="failure"})
# Job completion rate over the last hour
rate(thoras_job_completions_total[1h])
# Failure rate percentage
(sum(rate(thoras_job_completions_total{status="failure"}[24h]))
/ sum(rate(thoras_job_completions_total[24h]))) * 100
```
### Job Duration Seconds
**Metric:** `thoras_job_duration_seconds`
Measures the duration of completed jobs in seconds, broken down by status and
job kind. Use this to identify slow jobs or performance regressions.
**Example Queries & Dashboards:**
```promql theme={null}
# Average duration by job kind
avg by (kind) (thoras_job_duration_seconds)
# Jobs taking longer than 30 seconds
thoras_job_duration_seconds > 30
```
## Grafana Dashboard
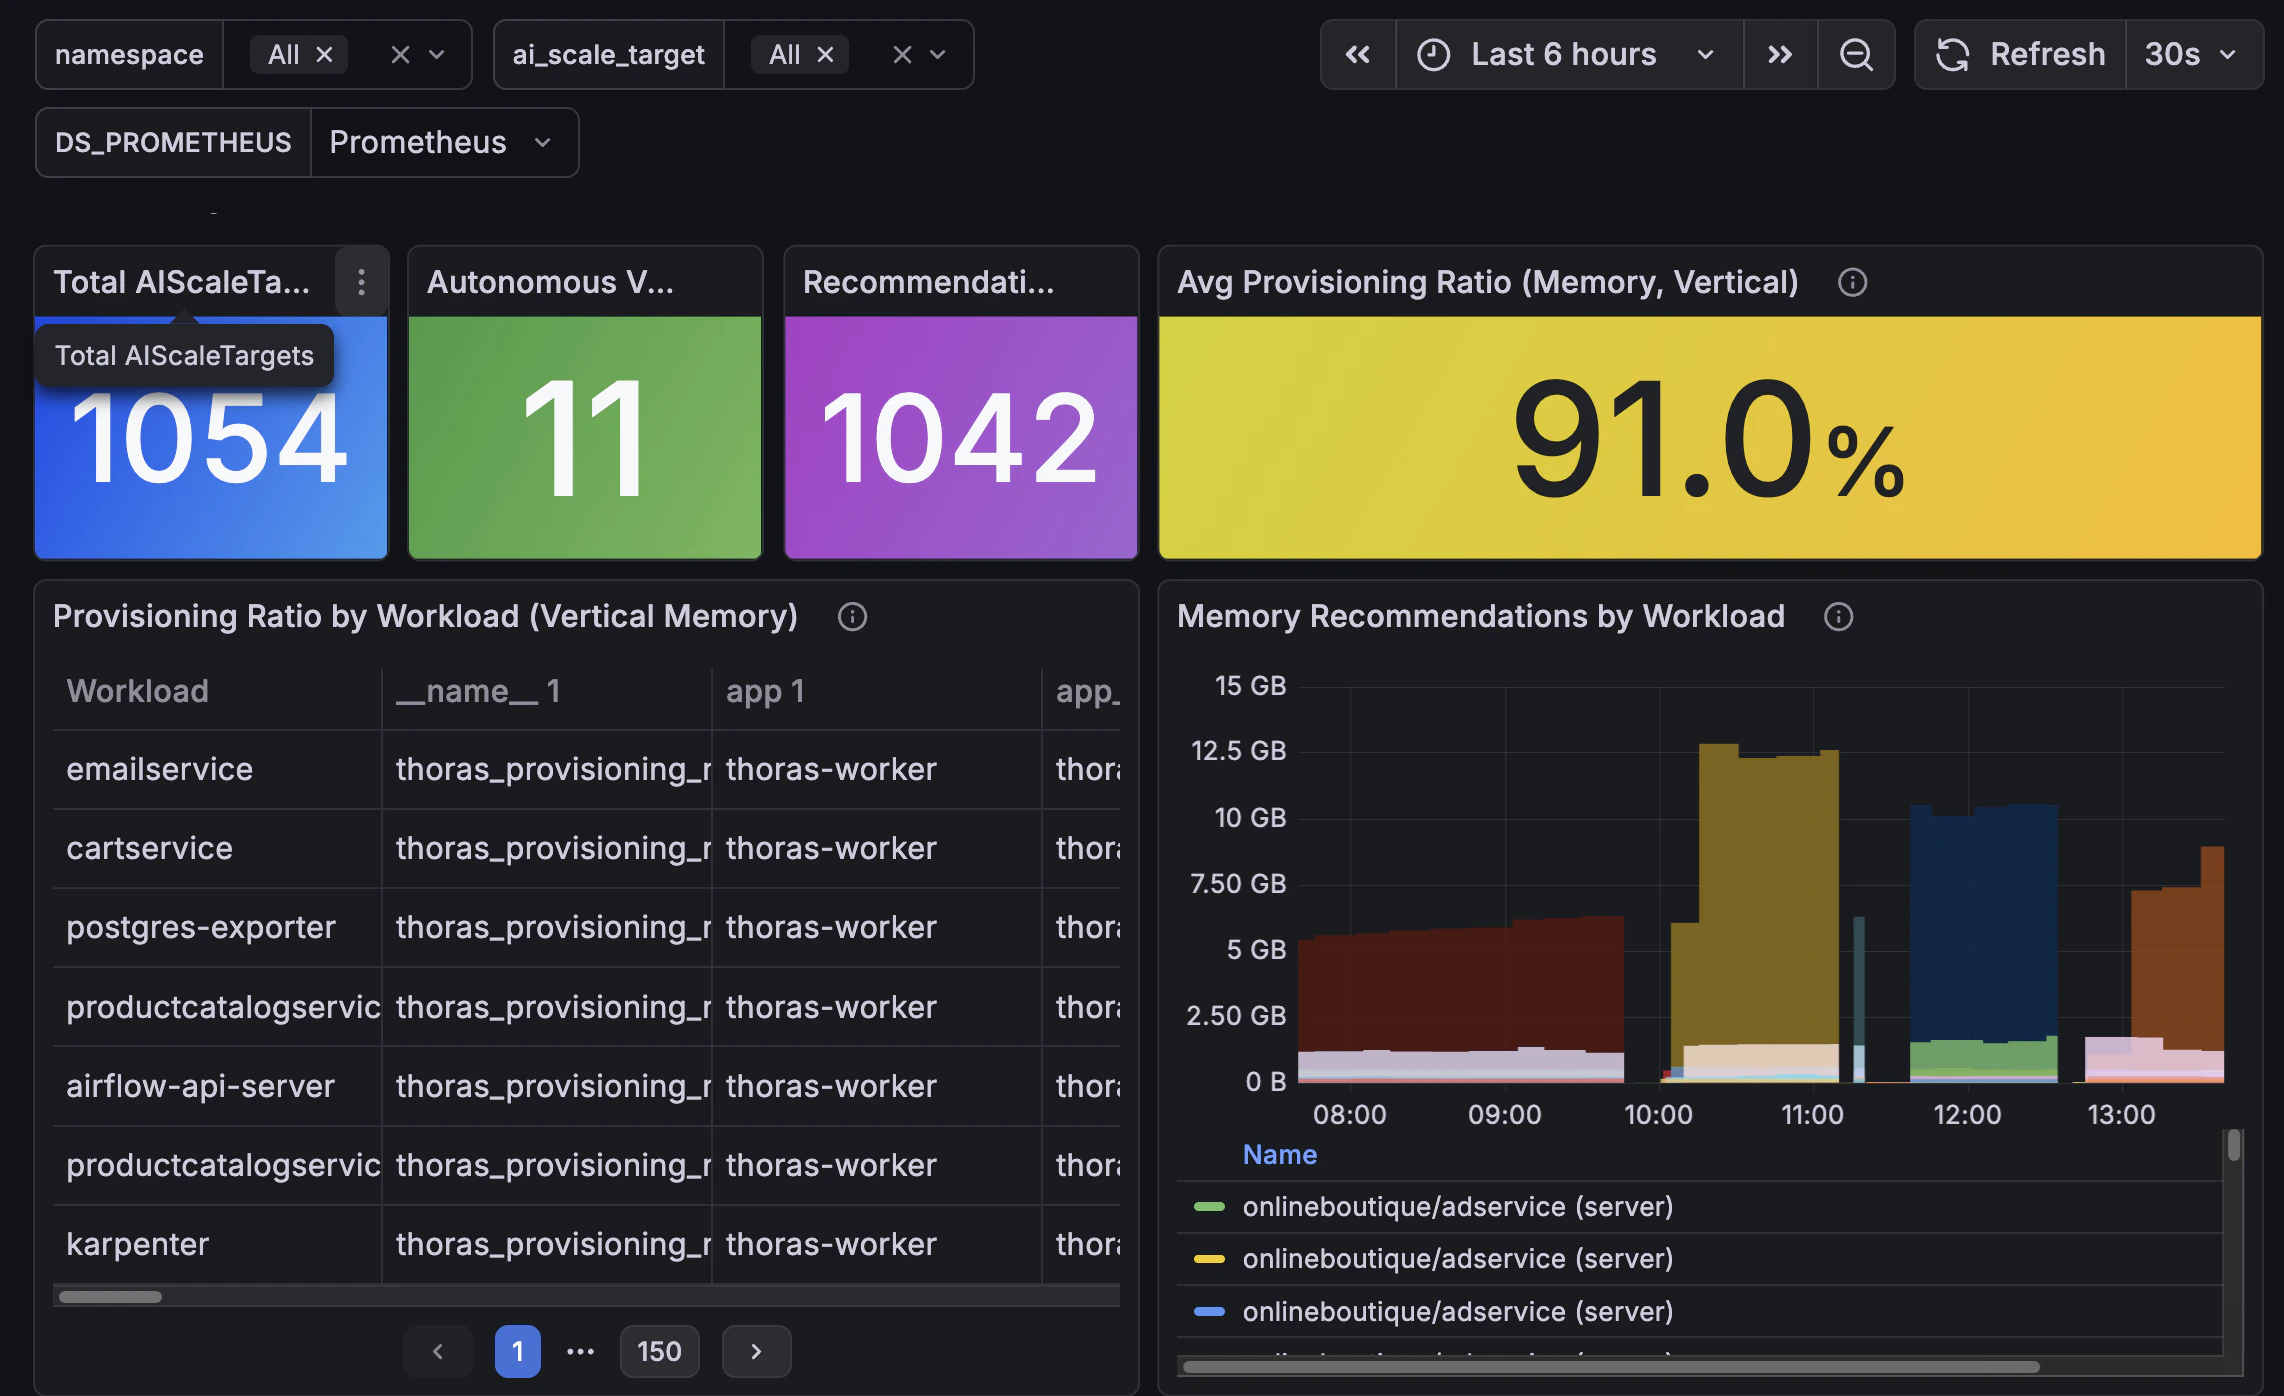
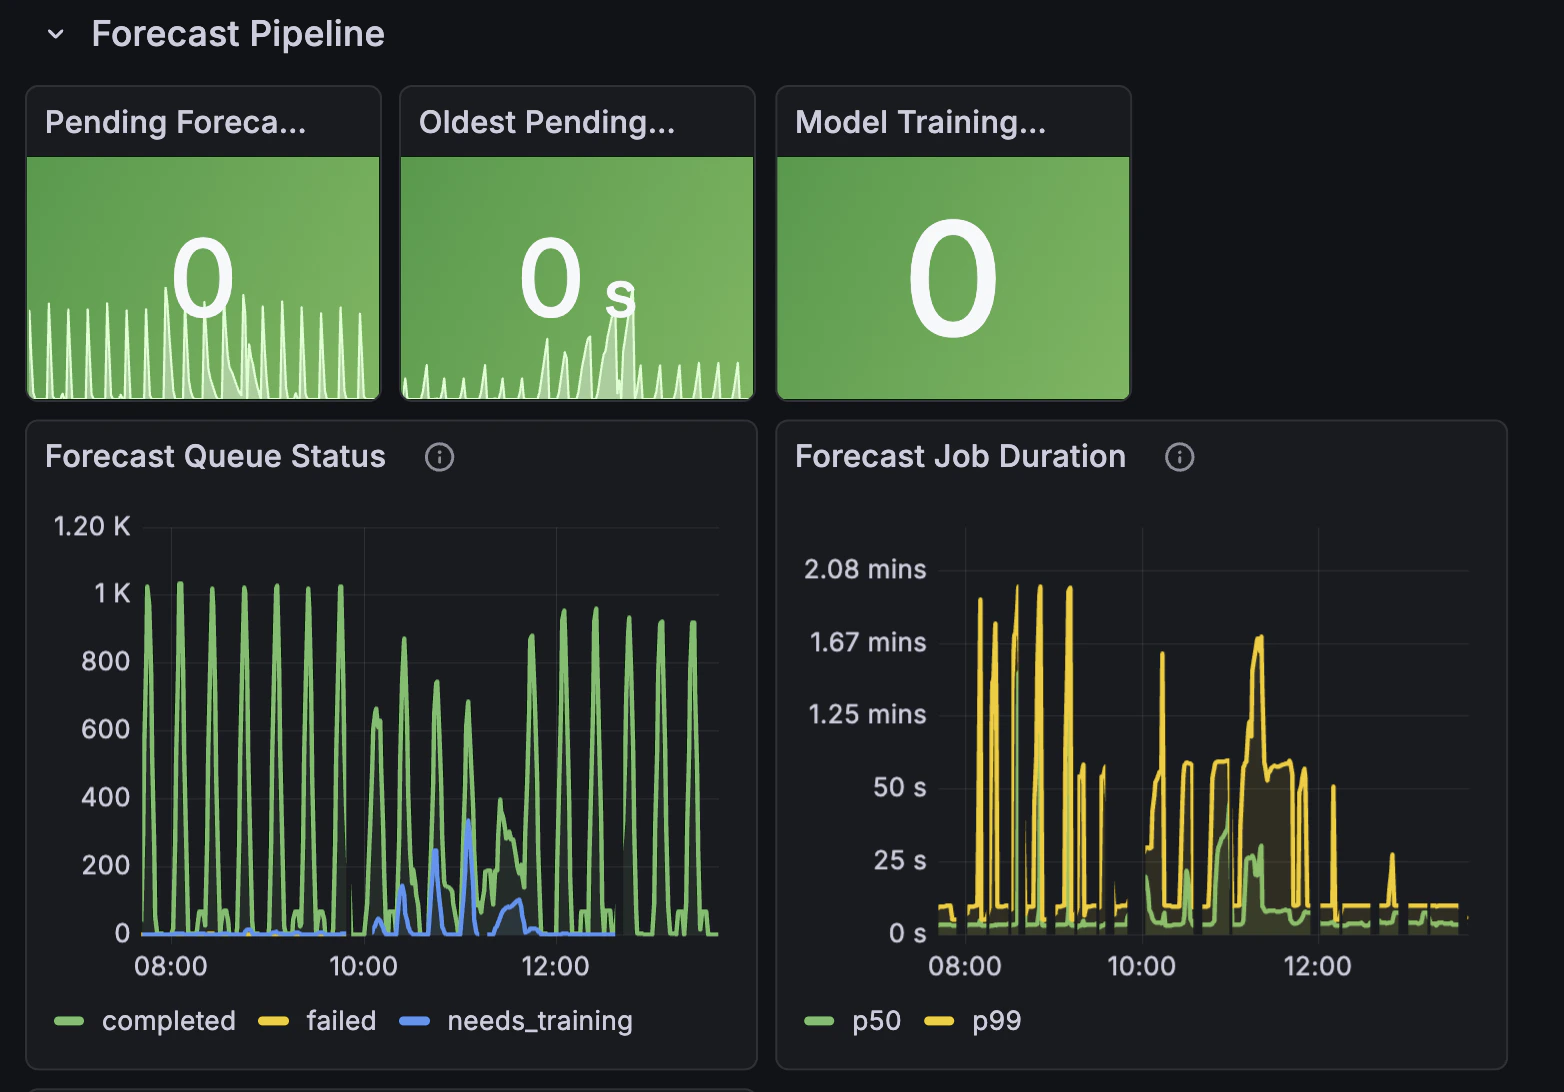
We provide a pre-built Grafana dashboard that visualizes Thoras metrics out of
the box. It includes panels for scaling activity, provisioning efficiency,
forecast pipeline health, API performance, and worker job status.
 ### Importing the Dashboard
1. Download the
[Thoras Grafana Dashboard](./static/thoras-grafana-dashboard.json)
2. In Grafana, go to **Dashboards > New > Import**
3. Click **Upload dashboard JSON file** and select the downloaded file
4. When prompted, select your Prometheus datasource that scrapes Thoras metrics
5. Click **Import**
### Prerequisites
* Thoras must be installed and exposing its Prometheus metrics endpoint
* A Prometheus instance must be scraping Thoras metrics
* Grafana must have that Prometheus instance configured as a datasource
### Importing the Dashboard
1. Download the
[Thoras Grafana Dashboard](./static/thoras-grafana-dashboard.json)
2. In Grafana, go to **Dashboards > New > Import**
3. Click **Upload dashboard JSON file** and select the downloaded file
4. When prompted, select your Prometheus datasource that scrapes Thoras metrics
5. Click **Import**
### Prerequisites
* Thoras must be installed and exposing its Prometheus metrics endpoint
* A Prometheus instance must be scraping Thoras metrics
* Grafana must have that Prometheus instance configured as a datasource